Ad Age представил TOP-100 американских рекламодателей
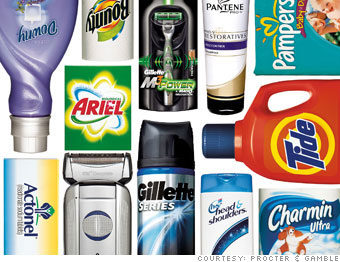
Рейтинг возглавила компания Procter & Gamble

|
| Иллюстрация с ресурса wordpress.com |
Ad Age представил традиционный рейтинг крупнейших национальных рекламодателей за 2010 год. TOP-100 возглавила Procter & Gamble. Рекламный бюджет компании составил 4,61 миллиарда долларов, по сравнению с 2009 годом он увеличился на 17,9%. В тройке лидеров - телекоммуникационная компания AT&T и автоконцерн General Motors, они потратили на рекламу 2,98 миллиарда и 2,86 миллиарда долларов соответственно.
В десятку крупнейших рекламодателей США вошли Verizon Communications, American Express, Pfizer, сеть Walmart, Time Warner, Johnson & Johnson и L'Oreal.
Среди других известных компаний - Toyota Motor находится на 16-м месте, Unilever на 21-м, Nestle - на 30-м. Замыкает список Colgate-Palmolive.
Совокупные расходы компаний - участников списка по сравнению с 2009 годом выросли на 8,8%.
Таблица с ресурса adage.com
| 100 LEADING NATIONAL ADVERTISERS |
| RANKED BY TOTAL U.S. ADVERTISING SPENDING IN 2010. DOLLARS IN MILLIONS. |
| RANK | | TOTAL U.S. AD SPENDING | | U.S. MEASURED MEDIA BREAKOUT FOR 2010 |
| 2010 | 2009 | ADVERTISER | HEADQUARTERS | 2010 | 2009 | % CHG | ESTIMATED UNME-
ASURED | MEASURED MEDIA | MAGA-
ZINES | NEWS-
PAPER | OUT-
DOOR | TV | RADIO | INTERNET |
| 1 |
1 |
Procter & Gamble Co.
|
Cincinnati |
$4,614.7 |
$3,915.1 |
17.9 |
$1,273.7 |
$3,341.1 |
$1,096.9 |
$202.7 |
$3.3 |
$1,851.8 |
$17.7 |
$168.8 |
| 2 |
3 |
AT&T 1
|
Dallas |
2,989.0 |
2,787.0 |
7.2 |
873.7 |
2,115.3 |
49.3 |
214.9 |
51.2 |
1,515.9 |
144.4 |
139.6 |
| 3 |
4 |
General Motors Co.
|
Detroit |
2,869.0 |
2,460.9 |
16.6 |
697.7 |
2,171.3 |
409.6 |
245.6 |
17.5 |
1,202.6 |
56.0 |
240.0 |
| 4 |
2 |
Verizon Communications
|
New York |
2,451.0 |
3,020.0 |
-18.8 |
573.7 |
1,877.3 |
87.1 |
291.0 |
69.6 |
1,106.1 |
154.3 |
169.2 |
| 5 |
19 |
American Express Co.
|
New York |
2,222.6 |
1,365.0 |
62.8 |
1,601.3 |
621.4 |
63.2 |
130.3 |
22.2 |
227.8 |
45.8 |
132.0 |
| 6 |
5 |
Pfizer
|
New York |
2,124.1 |
2,097.0 |
1.3 |
814.5 |
1,309.6 |
333.3 |
65.9 |
0.6 |
831.3 |
32.1 |
46.4 |
| 7 |
7 |
Walmart Stores
|
Bentonville, Ark. |
2,055.3 |
2,037.6 |
0.9 |
1,152.1 |
903.2 |
191.9 |
45.2 |
3.2 |
524.3 |
80.6 |
58.0 |
| 8 |
9 |
Time Warner
|
New York |
2,044.3 |
1,873.5 |
9.1 |
831.0 |
1,213.4 |
260.4 |
96.8 |
62.4 |
698.6 |
31.9 |
63.2 |
| 9 |
6 |
Johnson & Johnson
|
New Brunswick, N.J. |
2,026.5 |
2,060.9 |
-1.7 |
829.3 |
1,197.1 |
293.4 |
40.8 |
1.4 |
805.0 |
6.7 |
49.8 |
| 10 |
10 |
L'Oreal
|
Clichy, France |
1,978.8 |
1,838.6 |
7.6 |
825.9 |
1,152.9 |
566.1 |
38.9 |
1.8 |
536.5 |
0.6 |
8.9 |
| 11 |
8 |
Walt Disney Co.
|
Burbank, Calif. |
1,931.7 |
1,961.1 |
-1.5 |
838.0 |
1,093.7 |
178.1 |
87.7 |
36.3 |
546.1 |
58.5 |
186.9 |
| 12 |
21 |
JPMorgan Chase & Co.
|
New York |
1,916.7 |
1,341.0 |
42.9 |
1,356.6 |
560.1 |
59.6 |
92.1 |
36.3 |
272.7 |
62.1 |
37.2 |
| 13 |
15 |
Ford Motor Co.
|
Dearborn, Mich. |
1,914.9 |
1,474.9 |
29.8 |
758.1 |
1,156.8 |
144.7 |
20.1 |
3.9 |
809.8 |
32.9 |
145.4 |
| 14 |
11 |
Comcast Corp. 2
|
Philadelphia |
1,852.5 |
1,782.0 |
4.0 |
473.7 |
1,378.8 |
107.3 |
131.8 |
53.9 |
708.7 |
211.9 |
165.1 |
| 15 |
12 |
Sears Holdings Corp.
|
Hoffman Estates, Ill. |
1,778.6 |
1,700.3 |
4.6 |
1,076.3 |
702.3 |
29.5 |
157.4 |
0.9 |
470.7 |
29.2 |
14.6 |
| 16 |
24 |
Toyota Motor Corp.
|
Toyota City, Japan |
1,735.7 |
1,286.3 |
34.9 |
613.9 |
1,121.7 |
140.1 |
31.4 |
17.2 |
795.6 |
6.0 |
131.3 |
| 17 |
13 |
Bank of America Corp.
|
Charlotte, N.C. |
1,552.6 |
1,547.4 |
0.3 |
1,166.5 |
386.1 |
37.2 |
34.7 |
11.0 |
220.9 |
3.8 |
78.6 |
| 18 |
20 |
Target Corp.
|
Minneapolis |
1,508.0 |
1,346.0 |
12.0 |
858.0 |
650.0 |
102.9 |
142.2 |
14.5 |
337.5 |
25.2 |
27.7 |
| 19 |
17 |
Macy's
|
Cincinnati |
1,417.0 |
1,385.0 |
2.3 |
527.3 |
889.7 |
84.8 |
470.5 |
4.6 |
281.0 |
34.0 |
14.9 |
| 20 |
14 |
Sprint Nextel Corp.
|
Overland Park, Kan. |
1,400.0 |
1,500.0 |
-6.7 |
414.1 |
985.9 |
79.5 |
45.1 |
13.3 |
594.6 |
12.2 |
241.1 |
| 21 |
18 |
Unilever 3
|
Rotterdam, The Netherlands/London |
1,379.2 |
1,379.2 |
0.0 |
552.9 |
826.4 |
227.8 |
42.2 |
2.0 |
510.7 |
8.2 |
35.5 |
| 22 |
16 |
Anheuser-Busch InBev
|
Leuven, Belgium/St. Louis |
1,357.9 |
1,467.2 |
-7.5 |
797.1 |
560.8 |
40.6 |
2.5 |
34.3 |
446.4 |
25.3 |
11.7 |
| 23 |
26 |
Berkshire Hathaway
|
Omaha, Neb. |
1,343.6 |
1,153.6 |
16.5 |
376.2 |
967.4 |
152.5 |
19.6 |
30.0 |
648.9 |
102.8 |
13.7 |
| 24 |
27 |
News Corp.
|
New York |
1,319.5 |
1,117.0 |
18.1 |
368.5 |
951.0 |
54.0 |
235.0 |
32.0 |
466.1 |
84.4 |
79.4 |
| 25 |
22 |
J.C. Penney Co.
|
Plano, Texas |
1,317.0 |
1,315.0 |
0.2 |
903.0 |
414.0 |
51.4 |
102.3 |
1.5 |
214.5 |
24.5 |
19.8 |
| 26 |
25 |
McDonald's Corp.
|
Oak Brook, Ill. |
1,295.8 |
1,241.3 |
4.4 |
408.0 |
887.8 |
37.0 |
3.4 |
68.5 |
686.7 |
64.8 |
27.5 |
| 27 |
50 |
Fiat (Chrysler Group)
|
Turin, Italy/Auburn Hills, Mich. |
1,164.0 |
665.7 |
74.9 |
290.6 |
873.4 |
75.6 |
69.2 |
8.2 |
625.9 |
15.0 |
79.5 |
| 28 |
28 |
U.S. Government
|
Washington |
1,106.9 |
1,034.1 |
7.0 |
488.0 |
618.9 |
70.8 |
52.1 |
15.2 |
386.8 |
50.5 |
43.5 |
| 29 |
33 |
Honda Motor Co.
|
Tokyo |
1,060.7 |
951.3 |
11.5 |
370.9 |
689.8 |
96.6 |
17.4 |
4.9 |
521.7 |
12.1 |
37.2 |
| 30 |
32 |
Nestle
|
Vevey, Switzerland |
1,058.1 |
960.2 |
10.2 |
127.0 |
931.1 |
285.3 |
64.5 |
5.5 |
501.5 |
21.9 |
52.4 |
| 31 |
30 |
Kohl's Corp.
|
Menomonee Falls, Wis. |
1,017.0 |
988.0 |
2.9 |
677.1 |
339.9 |
4.6 |
123.6 |
0.2 |
159.2 |
42.8 |
9.5 |
| 32 |
38 |
Kraft Foods
|
Northfield, Ill. |
1,006.9 |
875.9 |
15.0 |
121.3 |
885.6 |
347.3 |
56.6 |
5.3 |
441.8 |
13.6 |
21.1 |
| 33 |
31 |
PepsiCo
|
Purchase, N.Y. |
1,005.8 |
986.1 |
2.0 |
421.1 |
584.7 |
135.3 |
23.8 |
8.6 |
358.1 |
23.6 |
35.3 |
| 34 |
29 |
GlaxoSmithKline
|
Brentford, Middlesex, U.K. |
1,002.3 |
1,000.0 |
0.2 |
311.4 |
690.9 |
131.9 |
13.2 |
0.8 |
515.5 |
10.7 |
18.7 |
| 35 |
39 |
General Mills
|
Minneapolis |
986.7 |
854.6 |
15.5 |
0.0 |
986.7 |
20.3 |
101.4 |
0.9 |
800.0 |
7.1 |
56.9 |
| 36 |
36 |
Viacom
|
New York |
969.6 |
893.9 |
8.5 |
351.9 |
617.7 |
24.0 |
39.8 |
25.7 |
450.8 |
31.5 |
45.9 |
| 37 |
41 |
Microsoft Corp.
|
Redmond, Wash. |
926.3 |
791.8 |
17.0 |
312.3 |
613.9 |
47.7 |
6.3 |
3.3 |
451.3 |
8.5 |
96.8 |
| 38 |
23 |
Merck & Co.
|
Whitehouse Station, N.J. |
921.1 |
1,286.5 |
-28.4 |
428.1 |
493.0 |
233.1 |
42.3 |
0.3 |
194.2 |
1.3 |
22.0 |
| 39 |
35 |
Sony Corp.
|
Tokyo |
892.4 |
914.2 |
-2.4 |
119.7 |
772.7 |
51.0 |
80.4 |
25.6 |
520.7 |
33.6 |
61.3 |
| 40 |
37 |
Nike
|
Beaverton, Ore. |
887.1 |
889.3 |
-0.2 |
770.7 |
116.4 |
35.3 |
0.4 |
1.4 |
70.0 |
0.3 |
9.0 |
| 41 |
58 |
Capital One Financial Corp.
|
McLean, Va. |
877.7 |
556.2 |
57.8 |
555.4 |
322.3 |
1.1 |
37.5 |
9.6 |
221.5 |
20.8 |
32.0 |
| 42 |
51 |
Nissan Motor Co.
|
Tokyo |
867.4 |
635.1 |
36.6 |
256.0 |
611.5 |
81.7 |
13.8 |
0.4 |
412.5 |
10.6 |
92.5 |
| 43 |
43 |
Eli Lilly & Co.
|
Indianapolis |
857.6 |
748.3 |
14.6 |
385.4 |
472.2 |
82.1 |
56.7 |
0.1 |
305.7 |
0.1 |
27.5 |
| 44 |
34 |
SABMiller (MillerCoors)
|
London/Chicago |
841.9 |
926.8 |
-9.2 |
448.1 |
393.8 |
9.9 |
2.7 |
39.5 |
308.2 |
25.5 |
8.0 |
| 45 |
46 |
Deutsche Telekom (T-Mobile) 1
|
Bonn, Germany |
820.4 |
718.7 |
14.1 |
237.9 |
582.5 |
7.7 |
113.3 |
2.5 |
398.8 |
6.5 |
53.7 |
| 46 |
42 |
Yum Brands
|
Louisville, Ky. |
797.9 |
783.1 |
1.9 |
68.3 |
729.5 |
3.3 |
3.3 |
6.0 |
678.2 |
29.9 |
8.8 |
| 47 |
44 |
Lowe's Cos.
|
Mooresville, N.C. |
778.2 |
743.3 |
4.7 |
388.3 |
389.9 |
31.8 |
34.4 |
8.0 |
263.2 |
25.4 |
27.1 |
| 48 |
48 |
AstraZeneca
|
London |
773.5 |
708.4 |
9.2 |
348.1 |
425.4 |
129.7 |
28.3 |
0.2 |
248.8 |
4.5 |
13.9 |
| 49 |
40 |
Home Depot
|
Atlanta |
768.7 |
802.1 |
-4.2 |
321.1 |
447.6 |
10.1 |
34.5 |
0.3 |
288.9 |
99.6 |
14.2 |
| 50 |
45 |
Coca-Cola Co.
|
Atlanta |
758.4 |
721.5 |
5.1 |
339.6 |
418.8 |
43.0 |
16.1 |
33.1 |
277.0 |
32.0 |
17.7 |
| 51 |
72 |
Progressive Corp.
|
Mayfield Village, Ohio |
743.4 |
470.3 |
58.1 |
237.9 |
505.5 |
6.7 |
5.1 |
2.7 |
325.9 |
20.4 |
144.8 |
| 52 |
49 |
Kellogg Co.
|
Battle Creek, Mich. |
722.9 |
697.8 |
3.6 |
73.9 |
649.0 |
152.6 |
16.8 |
0.0 |
435.7 |
1.7 |
42.3 |
| 53 |
53 |
Estee Lauder Cos.
|
New York |
698.1 |
586.6 |
19.0 |
506.9 |
191.2 |
129.2 |
1.1 |
1.4 |
56.9 |
0.0 |
2.6 |
| 54 |
76 |
Samsung Electronics Co.
|
Seoul |
683.3 |
449.6 |
52.0 |
410.1 |
273.1 |
59.0 |
6.2 |
13.2 |
158.1 |
3.9 |
32.7 |
| 55 |
55 |
LVMH Moet Hennessy Louis Vuitton
|
Paris |
683.1 |
568.1 |
20.2 |
435.6 |
247.5 |
192.2 |
31.1 |
8.1 |
13.7 |
0.4 |
2.0 |
| 56 |
52 |
Best Buy Co.
|
Richfield, Minn. |
666.5 |
629.2 |
5.9 |
399.7 |
266.8 |
1.8 |
96.1 |
1.3 |
147.3 |
3.6 |
16.7 |
| 57 |
59 |
State Farm Mutual Auto Insurance Co.
|
Bloomington, Ill. |
665.6 |
550.0 |
21.0 |
213.0 |
452.6 |
3.6 |
6.0 |
18.6 |
375.0 |
19.8 |
29.6 |
| 58 |
47 |
Bristol-Myers Squibb Co.
|
New York |
632.5 |
716.8 |
-11.8 |
301.9 |
330.6 |
79.0 |
0.1 |
0.0 |
241.0 |
0.0 |
10.4 |
| 59 |
65 |
Mars Inc.
|
McLean, Va. |
630.2 |
514.2 |
22.6 |
63.0 |
567.2 |
141.6 |
27.6 |
2.5 |
324.9 |
4.1 |
66.5 |
| 60 |
54 |
Wells Fargo & Co.
|
San Francisco |
630.0 |
572.0 |
10.1 |
441.4 |
188.6 |
20.3 |
35.5 |
11.4 |
76.6 |
28.1 |
16.7 |
| 61 |
56 |
Time Warner Cable
|
New York |
629.0 |
563.0 |
11.7 |
433.6 |
195.4 |
0.8 |
25.2 |
7.6 |
142.0 |
11.8 |
7.9 |
| 62 |
62 |
Visa
|
San Francisco |
559.1 |
532.4 |
5.0 |
353.0 |
206.1 |
20.6 |
3.8 |
4.3 |
150.9 |
14.0 |
12.5 |
| 63 |
66 |
Diageo
|
London |
550.4 |
509.0 |
8.1 |
400.0 |
150.5 |
9.9 |
8.0 |
24.8 |
83.5 |
14.6 |
9.6 |
| 64 |
57 |
Bayer
|
Leverkusen, Germany |
546.7 |
562.0 |
-2.7 |
177.1 |
369.5 |
89.5 |
11.6 |
0.2 |
257.0 |
3.9 |
7.4 |
| 65 |
91 |
Allstate Corp.
|
Northbrook, Ill. |
541.7 |
401.3 |
35.0 |
173.3 |
368.3 |
16.3 |
8.1 |
11.0 |
275.6 |
27.3 |
29.9 |
| 66 |
63 |
Kroger Co.
|
Cincinnati |
533.0 |
529.0 |
0.8 |
383.5 |
149.5 |
0.8 |
44.9 |
9.3 |
59.0 |
32.7 |
2.9 |
| 67 |
64 |
Novartis
|
Basel, Switzerland |
525.1 |
516.3 |
1.7 |
198.4 |
326.6 |
51.9 |
40.8 |
0.1 |
217.3 |
5.8 |
10.8 |
| 68 |
61 |
Campbell Soup Co.
|
Camden, N.J. |
522.8 |
538.9 |
-3.0 |
57.0 |
465.7 |
220.7 |
36.7 |
0.0 |
199.8 |
4.4 |
4.2 |
| 69 |
78 |
Citigroup
|
New York |
506.5 |
435.7 |
16.3 |
374.8 |
131.7 |
15.4 |
30.6 |
3.7 |
55.4 |
8.8 |
17.8 |
| 70 |
110 |
Amazon
|
Seattle |
486.8 |
310.4 |
56.8 |
324.1 |
162.7 |
42.1 |
12.4 |
0.2 |
83.0 |
1.0 |
23.9 |
| 71 |
75 |
Doctor's Associates (Subway)
|
Milford, Conn. |
477.0 |
450.0 |
6.0 |
46.8 |
430.2 |
2.1 |
5.7 |
8.1 |
381.6 |
30.6 |
2.1 |
| 72 |
67 |
Walgreen Co.
|
Deerfield, Ill. |
468.0 |
508.0 |
-7.9 |
252.1 |
215.9 |
16.9 |
64.7 |
0.9 |
101.6 |
25.9 |
5.9 |
| 73 |
90 |
Hyundai Motor Co.
|
Seoul |
467.8 |
401.7 |
16.5 |
152.2 |
315.6 |
34.3 |
3.9 |
1.5 |
248.7 |
3.9 |
23.3 |
| 74 |
88 |
Discover Financial Services
|
Riverwoods, Ill. |
463.1 |
406.0 |
14.1 |
285.1 |
178.0 |
53.3 |
14.0 |
1.0 |
90.0 |
8.6 |
11.0 |
| 75 |
71 |
Wendy's/Arby's Group 4
|
Atlanta |
460.0 |
471.1 |
-2.4 |
80.7 |
379.4 |
8.2 |
0.7 |
7.9 |
313.1 |
27.9 |
21.5 |
| 76 |
70 |
Reckitt Benckiser
|
Slough, Berkshire, U.K. |
459.7 |
476.2 |
-3.5 |
0.0 |
459.7 |
89.5 |
57.0 |
0.0 |
304.4 |
3.7 |
5.1 |
| 77 |
79 |
Fortune Brands
|
Deerfield, Ill. |
456.6 |
432.5 |
5.6 |
354.9 |
101.7 |
43.0 |
2.4 |
6.6 |
41.8 |
0.8 |
7.2 |
| 78 |
123 |
Hershey Co.
|
Hershey, Pa. |
440.6 |
271.7 |
62.2 |
0.0 |
440.6 |
42.1 |
14.3 |
2.4 |
374.7 |
5.8 |
1.4 |
| 79 |
82 |
Limited Brands
|
Columbus, Ohio |
435.5 |
425.1 |
2.5 |
373.5 |
62.0 |
1.3 |
0.1 |
0.0 |
57.6 |
0.1 |
2.9 |
| 80 |
73 |
Abbott Laboratories
|
Abbott Park, Ill. |
432.4 |
465.0 |
-7.0 |
184.6 |
247.7 |
54.4 |
1.3 |
0.3 |
180.3 |
0.4 |
10.9 |
| 81 |
86 |
DirecTV
|
El Segundo, Calif. |
431.7 |
413.0 |
4.5 |
0.0 |
431.7 |
24.0 |
24.5 |
0.2 |
376.4 |
1.3 |
5.5 |
| 82 |
80 |
SC Johnson
|
Racine, Wis. |
431.7 |
431.1 |
0.1 |
17.3 |
414.4 |
77.1 |
62.0 |
0.0 |
266.5 |
2.6 |
6.2 |
| 83 |
94 |
Volkswagen
|
Wolfsburg, Germany |
431.3 |
368.0 |
17.2 |
138.0 |
293.3 |
24.9 |
3.7 |
3.0 |
229.8 |
4.5 |
27.4 |
| 84 |
81 |
Safeway
|
Pleasanton, Calif. |
431.0 |
430.6 |
0.1 |
242.7 |
188.3 |
0.7 |
35.0 |
0.4 |
41.7 |
103.4 |
7.1 |
| 85 |
105 |
Daimler
|
Stuttgart, Germany |
426.9 |
338.5 |
26.1 |
153.5 |
273.4 |
31.4 |
15.7 |
1.7 |
195.3 |
11.8 |
17.5 |
| 86 |
100 |
Apple
|
Cupertino, Calif. |
420.4 |
353.3 |
19.0 |
100.9 |
319.5 |
20.6 |
8.1 |
33.4 |
232.4 |
0.9 |
24.3 |
| 87 |
133 |
Coty
|
New York |
417.6 |
250.8 |
66.5 |
168.3 |
249.3 |
210.7 |
3.0 |
0.2 |
32.6 |
0.5 |
2.1 |
| 88 |
77 |
IBM Corp.
|
Armonk, N.Y. |
417.4 |
446.5 |
-6.5 |
243.3 |
174.1 |
59.5 |
16.5 |
7.8 |
61.6 |
6.1 |
22.7 |
| 89 |
92 |
Apollo Group
|
Phoenix |
417.2 |
377.1 |
10.6 |
229.7 |
187.5 |
2.6 |
0.3 |
5.2 |
63.0 |
1.9 |
114.6 |
| 90 |
84 |
Gap Inc.
|
San Francisco |
413.1 |
419.5 |
-1.5 |
90.8 |
322.3 |
81.8 |
5.9 |
6.2 |
199.4 |
19.9 |
9.2 |
| 91 |
117 |
Kia Motors Corp.
|
Seoul |
411.0 |
288.4 |
42.5 |
133.4 |
277.6 |
13.0 |
4.3 |
1.8 |
243.9 |
0.1 |
14.6 |
| 92 |
85 |
Dish Network Corp.
|
Englewood, Colo. |
409.5 |
415.6 |
-1.5 |
0.0 |
409.5 |
10.0 |
23.3 |
1.1 |
350.7 |
14.9 |
9.4 |
| 93 |
74 |
Clorox Co.
|
Oakland, Calif. |
405.1 |
457.1 |
-11.4 |
17.5 |
387.6 |
124.1 |
11.0 |
0.0 |
231.2 |
4.0 |
17.3 |
| 94 |
104 |
Hewlett-Packard Co.
|
Palo Alto, Calif. |
405.0 |
340.0 |
19.1 |
160.7 |
244.3 |
35.2 |
37.5 |
4.7 |
111.2 |
20.2 |
35.5 |
| 95 |
60 |
CVS Caremark Corp.
|
Woonsocket, R.I. |
400.0 |
542.0 |
-26.2 |
292.6 |
107.4 |
1.4 |
56.0 |
1.6 |
39.3 |
5.2 |
4.0 |
| 96 |
95 |
Dr Pepper Snapple Group
|
Plano, Texas |
397.1 |
367.4 |
8.1 |
177.8 |
219.3 |
6.1 |
4.0 |
8.6 |
172.5 |
15.1 |
13.0 |
| 97 |
89 |
Burger King Holdings
|
Miami |
392.0 |
401.9 |
-2.5 |
91.3 |
300.7 |
0.7 |
0.4 |
6.5 |
272.7 |
15.9 |
4.5 |
| 98 |
83 |
Dell
|
Round Rock, Texas |
391.1 |
422.7 |
-7.5 |
155.1 |
235.9 |
33.1 |
27.2 |
2.0 |
125.6 |
0.7 |
47.3 |
| 99 |
101 |
Fry's Electronics
|
San Jose, Calif. |
384.8 |
350.0 |
10.0 |
153.9 |
230.9 |
0.0 |
227.8 |
0.0 |
1.5 |
0.7 |
0.9 |
| 100 |
97 |
Colgate-Palmolive Co.
|
New York |
384.7 |
365.1 |
5.4 |
223.5 |
161.2 |
34.4 |
34.6 |
0.0 |
81.8 |
1.8 |
8.5 |
| Source: Ad Age DataCenter. Numbers rounded. Measured media from WPP's Kantar Media (kantarmediana.com). See Methodology. 2010 and 2009 rankings based on data compiled in 2011. Measured media from WPP's Kantar Media (kantarmediana.com) based on spending in 19 media: magazine—consumer magazines, Sunday magazines, local magazines and business-to-business magazines; newspaper—local and national newspapers, free-standing inserts; TV—broadcast network TV, spot TV, syndicated TV and network cable TV; radio—network, national spot and local; Spanish-language magazines, newspapers and TV networks; outdoor; and internet (display advertising; excludes paid search and broadband video). Unmeasured spending is Ad Age DataCenter estimate including direct marketing, promotion, internet paid search, social media and other forms of spending not tracked in measured media. 1. AT&T in March 2011 struck a deal to buy T-Mobile USA (No. 45). 2. Comcast bought 51% stake in NBC Universal in January 2011; estimated ad spending shown is pro forma including NBC Universal. 3. Estimated pro forma ad spending including Alberto Culver Co. (acquired in May 2011). 4. Wendy's/Arby's Group in June 2011 agreed to sell Arby's to a private-equity firm. |
|